Catching Joe DiMaggio
A bit of an intro
I’m planning on doing some of the Riddler puzzles, as time permits. I generally like solving the problems, and I like reading other solutions. That being said, I’m planning on taking the simulation approach rather than the analytic approach. This is mostly because I want to play with code more often, and I like solving problems with code.
Now, on to the riddle!
Catching Joe DiMaggio’s hit streak
The idea this week is to figure out how likely someone is to beat Joltin’ Joe DiMaggio’s hitting record of 56 games:
Five brothers join the Riddler Baseball Independent Society, or RBIs. Each of them enjoys a lengthy career of 20 seasons, with 160 games per season and four plate appearances per game. (To make this simple, assume each plate appearance results in a hit or an out, so there are no sac > flies or walks to complicate this math.)
Given that their batting averages are .200, .250, .300, .350 and .400, what are each brother’s chances of beating DiMaggio’s 56-game hitting streak at some point in his career? (Streaks can span across seasons.)
By the way, their cousin has a .500 average, but he will get tossed from the league after his 10th season when he tests positive for performance enhancers. What are his chances of beating the streak?
Some limitations/assumptions
Before we begin, I’m going to point out some limitations for this:
- Yes, it makes the simulation easier. But we are skipping walks, sacrifices, errors, etc. That makes baseball cool, and leaving them out makes me sad.
- We are basically assuming that all of these players (even the roid rager) are ironmen on the order of Cal Ripken Jr.. So all 5 players would be on the list of players with the longest consecutive games played streaks. This is especially dubious for the roid rager as PEDs tend to lead to injuries–Sammy Sosa says sneezing is dangerous.
- The assumptions about all of the batting averages greater than 0.350 are dubious at best. Ty Cobb is the MLB leader in career batting average, and he hit 0.366. The next best hitter was Rogers Hornsby with a career average of 0.359. Even the assumption that our enhanced hitter would have a 0.500 average is suspect. There have only been 28 players who have hit 0.400 or better in a season, and the last one was Ted Williams in 1941, and the best batting average ever was 0.440. We haven’t been anywhere near a 0.500 batting average. Ever. So the PEDs that riddler cousin is taking must be truly revolutionary.
- We are given each brother’s batting average, but we aren’t told whether it is the same for each season. For the purposes of these calculations, I’m treating it simply as the probability for getting a hit. It makes the code slightly incorrect, but easier. Note that for a 20 year career, there are 3200 at bats, and that means that in order to record a 0.300 batting average, the player would need between 959 hits and 961 hits.
Functions to build the simulation
There are three functions that I will use to accomplish the required tasks. First I will generate the hits for a person’s career. The inputs to this are the career batting average and the number of seasons. That being said, this is probably something that could be improved (as I’m just using the uniform distribution to generate whether a particular at-bat was a hit or not, rather than using the batting average to globally decide how many hits are and spreading them across all possible at bats). This is the equivalent of flipping a coin 10 times – when you do this, the most probable outcome is 5 heads and 5 tails. However, if you do it, sometimes you’ll get 4 heads, or 3 heads, or 9 heads…Now if you do that experiment lots of times, 5 heads will be the most frequent outcome. So, we will see the “correct” outcome only 6.1% of the time (for the 0.300 player, it’s slightly worse for the higher batting averages).
generateHits = function(ba,seasons){
  games = seasons * 160           #160 games/season
  atBats = games * 4              #4 at bats/game
  hits = ifelse(runif(atBats)<ba,1,0)  # If the at-bat is successful, enter a 1, otherwise make it a 0.
  return(hits)
}
Now that all of the hits have been generated, we can find out which games had a hit (and which ones didn’t). This is where R’s ability to reformat a vector into a matrix comes in handy.
gamesWithHit = function(hits){
  ## Re-flow the hit data into a matrix so each column has all of the at-bats in a game.
  hitMat = matrix(hits,nrow=4)
  ## Create a vector with 0 if no hits in a game and 1 if there are hits in a game.
  gwh = as.numeric(colSums(hitMat)>0)
  return(gwh)
}
Now we need to go through the list of games and count up the streak statistics. I’m doing this the brute force way. I thought about using cumSum, but that seemed to be more trouble than it was worth. I try to avoid for loops in R, but sometimes, they make sense. I’m sure someone else would do this with apply.
longestStreak = function(games){
  ## Initialize current and longest streaks
  longestStreak = 0
  currentStreak = 0
  for(g in 1:length(games)){
    ## If game had a hit, add 1 to current streak, otherwise, end the streak
    currentStreak = ifelse(games[g]>0,currentStreak+1,0)
    ## If current streak is longer than longest streak, make it the longest streak, otherwise, leave longest streak
    ## alone
    longestStreak = ifelse(currentStreak>longestStreak,currentStreak,longestStreak)
  }
  return(longestStreak)
}
Results
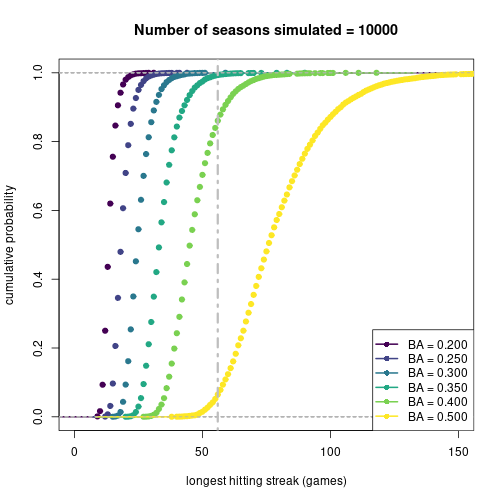
For each player, I’ll simulate 10,000 careers (with 20 or 10 seasons each depending on the player). Then I’ll determine the longest hitting streak in each career. Finally, I’ll calculate the cumulative probability for a career to have a maximum hitting streak based on the simulated data. Here is a plot of the cumulative probability distribution for each player:

And now here are the results:
Table: The probability each player catches DiMaggio
| players | averages | prob |
|---|---|---|
| player1 | 0.20 | 0.000 |
| player2 | 0.25 | 0.000 |
| player3 | 0.30 | 0.000 |
| player4 | 0.35 | 0.007 |
| player5 | 0.40 | 0.139 |
| pedPlayer | 0.50 | 0.935 |
As expected, as batting average goes up, the probability to catch DiMaggio goes up. But I suppose the lesson learned here is that cheaters can prosper (94%!?!?!) if they go long enough without getting caught.
Extension
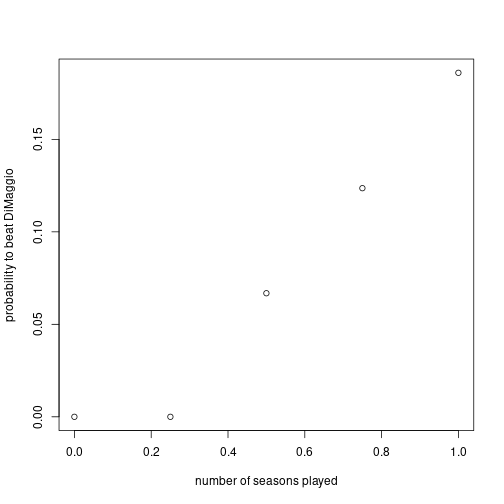
Ok, so the record-breaking performance-enhancing cheater is not quite a satisfying answer to think about. I want to know how many seasons the cousin has to play in order to have a 15% chance of breaking DiMaggio’s streak. Why 15%? Well, that’s (rounded off) the percent chance that the 0.400 hitter had of breaking DiMaggio’s streak over the span of a 20 year career. This would actually be useful in determining an appropriate interval for getting everyone in the league randomly tested for PEDs if one goal is to keep the record book meaningful.

So it looks like 1 season is long enough for our enhanced friend have (about) the same probability to break DiMaggio’s record as our best-hitting rule-follower.